MySQL 8 ШЋаТВщПДжїДгбгГйЕФЗНЗЈ
ЮвУЧжаЕФаэЖрШЫЃЌЯждкЕФЕФMySQL DBAЪЙгУSHOW REPLICA STATUSжаЕФSeconds_Behind_SourceРДСЫНтЃЈвьВНЃЉИДжЦЕФзДЬЌКЭе§ШЗжДааЁЃ
ЧызЂвтаТЕФММЪѕЁЃЮвЯраХЮвУЧЖМгУЙ§ОЩЕФЪѕгяЁЃ
ШЛЖјЃЌMySQLИДжЦвбОЗЂеЙСЫКмЖрЃЌИДжЦЭХЖгвбОХЌСІАќКЌСЫаэЖрЙигкMySQLПЩгУЕФЫљгаИДжЦЗНЪНЕФгагУаХЯЂЁЃ
Р§ШчЃЌЮвУЧЬэМгСЫВЂааИДжЦЁЂзщИДжЦЁЁЫљгаетаЉаХЯЂЖМЪЧДгОЩЕФSHOW REPLICA STATUSНсЙћжаПДВЛЕНЕФЁЃ
ЪЙгУPerformance_SchemaПЩвдИќКУЕиМрЪгКЭЙлВьИДжЦЙ§ГЬЁЃ
ЕБЧАдкPerformance_SchemaжаЃЌга15ИіБэгыИДжЦМьВтгаЙиЃК
+------------------------------------------------------+
| Tables_in_performance_schema (replication%) |
+------------------------------------------------------+
| replication_applier_configuration |
| replication_applier_filters |
| replication_applier_global_filters |
| replication_applier_status |
| replication_applier_status_by_coordinator |
| replication_applier_status_by_worker |
| replication_asynchronous_connection_failover |
| replication_asynchronous_connection_failover_managed |
| replication_connection_configuration |
| replication_connection_status |
| replication_group_communication_information |
| replication_group_configuration_version |
| replication_group_member_actions |
| replication_group_member_stats |
| replication_group_members |
+------------------------------------------------------+
15 rows in set (0.0038 sec)
ЕЋШЗЪЕЃЌвЊРэНтетаЉжИБъЕФКЌвхвдМАдкФФРябАевЖдЮвУЧMySQL DBAживЊЕФгагУаХЯЂВЂВЛзмЪЧФЧУДШнвзЃКЮвЕФИДжЦТфКѓгкдДПтТ№ЃП
ЮвДДНЈСЫвЛаЉПЩвдАВзАдкsysжаЕФЪгЭМЃЌвдЪЙгУетаЉЖШСПжаЕФДѓЖрЪ§РДЛёЕУгыЮвУЧDBAЯрЙиЕФЖЋЮїЃКmysql_8_replication_observability.sql [https://gist.github.com/lefred/1bad64403923664a14e0f20f572d7526]
ШУЮвУЧзаЯИПДПДетаЉЙлЕуЁЃ
ВщПДИДжЦбгГйЕФSQL:
select * from sys.replication_lag;
+---------------------------+-----------------------+------------------------+
| channel_name | max_lag_from_original | max_lag_from_immediate |
+---------------------------+-----------------------+------------------------+
| clusterset_replication | 00:00:04.963223 | 00:00:04.940782 |
| group_replication_applier | 0 | 0 |
+---------------------------+-----------------------+------------------------+
ДгЩЯУцЕФЪфГіжаЃЌЮвУЧПЩвдПДЕНMySQLЪЕР§ЪЧвЛИівьВНИББОЃЌЕЋЫќвВЪЧзщИДжЦМЏШКЕФвЛВПЗжЁЃ
ЪТЪЕЩЯЃЌетЪЧInnoDB ClusterSetжаDRМЏШКЕФжївЊГЩдБЁЃ
ЮвУЧЛЙПЩвдПДЕНЃЌетИіИДжЦИББОМИКѕбгГйСЫ5УыЃЈжЭКѓЃЉЁЃ
ШЛКѓЃЌЮвУЧгаСЫИДжЦЭЈЕРЕФУћГЦКЭгыдЪМЬсНЛЦїКЭжБНгдДЃЈдкМЖСЊИДжЦЕФЧщПіЯТЃЉЕФзюДѓбгГй/жЭКѓЃЈвђЮЊдкВЂааИДжЦЕФЧщПіжаПЩФмгаМИИіЙЄзїепЃЉЁЃ
дкзщИДжЦМЏШКЃЈInnoDB clusterЃЉЕФИЈжњГЩдБЩЯЃЌЮвУЧПЩвдПДЕНвдЯТЪфГіЃК
select * from sys.replication_lag;
+----------------------------+-----------------------+------------------------+
| channel_name | max_lag_from_original | max_lag_from_immediate |
+----------------------------+-----------------------+------------------------+
| group_replication_recovery | null | null |
| group_replication_applier | 00:00:02.733008 | 00:00:02.733008 |
+----------------------------+-----------------------+------------------------+
ЮвУЧПЩвдПДЕНЃЌгУгкЛжИДЕФЭЈЕРЃЈдкНкЕуМгШызщЪБЖСШЁЖЊЪЇЕФЖўНјжЦШежОЪТМўЁЂЪТЮёЃЉУЛгаБЛЪЙгУЃЌВЂЧвзщИДжЦЕФгІгУГЬађгаЕуТфКѓЁЃ
ИДжЦзДЬЌ
етИіЪгЭМИќЭъећЃЌУПИіwordersЖМгавЛааЁЃ
ШУЮвУЧвдInnoDB ClusterSetЕФDRеОЕуЕФPrimaryГЩдБЮЊР§ЃК
select * from replication_status;
+-------------------------------+----------+----------+---------+-------------------+--------------------+
| channel | io_state | co_state | w_state | lag_from_original | lag_from_immediate |
+-------------------------------+----------+----------+---------+-------------------+--------------------+
| group_replication_applier (1) | ON | ON | ON | none | none |
| group_replication_applier (2) | ON | ON | ON | none | none |
| group_replication_applier (3) | ON | ON | ON | none | none |
| group_replication_applier (4) | ON | ON | ON | none | none |
| clusterset_replication (1) | ON | ON | ON | 00:00:15.395870 | 00:00:15.380884 |
| clusterset_replication (2) | ON | ON | ON | 00:00:15.395686 | 00:00:15.380874 |
| clusterset_replication (3) | ON | ON | ON | 00:00:15.411204 | 00:00:15.388451 |
| clusterset_replication (4) | ON | ON | ON | 00:00:15.406154 | 00:00:15.388434 |
+-------------------------------+----------+----------+---------+-------------------+--------------------+
ЮвУЧПЩвдПДЕНЃЌРДздPrimaryМЏШКЕФВЂааЃЈвьВНЃЉИДжЦЪЙгУСЫ4ИіВЂааЙЄзїЯпГЬЁЃ
ЮвУЧЛЙПЩвдПДЕНЃЌЫћУЧе§дкТфКѓЁ
ФњПЩФмвбОзЂвтЕНга3жжзДЬЌЃЈОљЮЊONЃЉЁЃЪЙгУSHOW REPLICA STATUSЃЌЮвУЧжЛФмПДЕНЃК
Replica_IO_Running: Yes
Replica_SQL_Running: Yes
ЖдгкВЂааИДжЦЃЌдкгІгУbinlogЪТМўЦкМфЃЌЮвУЧгаСэвЛИіВЮгыИДжЦЕФЯпГЬЃКаЕїЦїЯпГЬЁЃ
ВщПДЭъећЕФИДжЦзДЬЌЃК
select * from sys.replication_status_full\G
*************************** 1. row ***************************
channel: group_replication_applier (1)
host: <NULL>
port: 0
user:
source_uuid: 7b6bf13d-40ed-11ee-bfdd-c8cb9e32df8e
group_name: 7b6bf13d-40ed-11ee-bfdd-c8cb9e32df8e
last_heartbeat_timestamp: 0000-00-00 00:00:00.000000
heartbeat_interval: 30
io_state: ON
io_thread_state: NULL
io_errno: 0
io_errmsg:
io_errtime: 0000-00-00 00:00:00.000000
co_state: ON
co_thread_state: Replica has read all relay log; waiting for more updates
co_errno: 0
co_errmsg:
co_errtime: 0000-00-00 00:00:00.000000
w_state: ON
w_thread_state: Waiting for an event from Coordinator
w_errno: 0
w_errmsg:
w_errtime: 0000-00-00 00:00:00.000000
time_since_last_message: 03:36:40.474223
applier_busy_state: IDLE
lag_from_original: none
lag_from_immediate: none
transport_time: 1.80 us
time_to_relay_log: 12.00 us
apply_time: 784.00 us
last_applied_transaction: 7b6bf4f0-40ed-11ee-bfdd-c8cb9e32df8e:3
last_queued_transaction: 7b6bf4f0-40ed-11ee-bfdd-c8cb9e32df8e:3
queued_gtid_set_to_apply:
*************************** 2. row ***************************
channel: group_replication_applier (2)
host: <NULL>
port: 0
user:
source_uuid: 7b6bf13d-40ed-11ee-bfdd-c8cb9e32df8e
group_name: 7b6bf13d-40ed-11ee-bfdd-c8cb9e32df8e
last_heartbeat_timestamp: 0000-00-00 00:00:00.000000
heartbeat_interval: 30
io_state: ON
io_thread_state: NULL
io_errno: 0
io_errmsg:
io_errtime: 0000-00-00 00:00:00.000000
co_state: ON
co_thread_state: Replica has read all relay log; waiting for more updates
co_errno: 0
co_errmsg:
co_errtime: 0000-00-00 00:00:00.000000
w_state: ON
w_thread_state: Waiting for an event from Coordinator
w_errno: 0
w_errmsg:
w_errtime: 0000-00-00 00:00:00.000000
time_since_last_message: 03:36:40.474223
applier_busy_state: IDLE
lag_from_original: none
lag_from_immediate: none
transport_time: 1.80 us
time_to_relay_log: 12.00 us
apply_time: 0 ps
last_applied_transaction:
last_queued_transaction: 7b6bf4f0-40ed-11ee-bfdd-c8cb9e32df8e:3
queued_gtid_set_to_apply:
*************************** 3. row ***************************
channel: group_replication_applier (3)
host: <NULL>
port: 0
user:
source_uuid: 7b6bf13d-40ed-11ee-bfdd-c8cb9e32df8e
group_name: 7b6bf13d-40ed-11ee-bfdd-c8cb9e32df8e
last_heartbeat_timestamp: 0000-00-00 00:00:00.000000
heartbeat_interval: 30
io_state: ON
io_thread_state: NULL
io_errno: 0
io_errmsg:
io_errtime: 0000-00-00 00:00:00.000000
co_state: ON
co_thread_state: Replica has read all relay log; waiting for more updates
co_errno: 0
co_errmsg:
co_errtime: 0000-00-00 00:00:00.000000
w_state: ON
w_thread_state: Waiting for an event from Coordinator
w_errno: 0
w_errmsg:
w_errtime: 0000-00-00 00:00:00.000000
time_since_last_message: 03:36:40.474223
applier_busy_state: IDLE
lag_from_original: none
lag_from_immediate: none
transport_time: 1.80 us
time_to_relay_log: 12.00 us
apply_time: 0 ps
last_applied_transaction:
last_queued_transaction: 7b6bf4f0-40ed-11ee-bfdd-c8cb9e32df8e:3
queued_gtid_set_to_apply:
*************************** 4. row ***************************
channel: group_replication_applier (4)
host: <NULL>
port: 0
user:
source_uuid: 7b6bf13d-40ed-11ee-bfdd-c8cb9e32df8e
group_name: 7b6bf13d-40ed-11ee-bfdd-c8cb9e32df8e
last_heartbeat_timestamp: 0000-00-00 00:00:00.000000
heartbeat_interval: 30
io_state: ON
io_thread_state: NULL
io_errno: 0
io_errmsg:
io_errtime: 0000-00-00 00:00:00.000000
co_state: ON
co_thread_state: Replica has read all relay log; waiting for more updates
co_errno: 0
co_errmsg:
co_errtime: 0000-00-00 00:00:00.000000
w_state: ON
w_thread_state: Waiting for an event from Coordinator
w_errno: 0
w_errmsg:
w_errtime: 0000-00-00 00:00:00.000000
time_since_last_message: 03:36:40.474223
applier_busy_state: IDLE
lag_from_original: none
lag_from_immediate: none
transport_time: 1.80 us
time_to_relay_log: 12.00 us
apply_time: 0 ps
last_applied_transaction:
last_queued_transaction: 7b6bf4f0-40ed-11ee-bfdd-c8cb9e32df8e:3
queued_gtid_set_to_apply:
*************************** 5. row ***************************
channel: clusterset_replication (1)
host: 127.0.0.1
port: 3310
user: mysql_innodb_cs_b0adbc6c
source_uuid: 2cb77a02-40eb-11ee-83f4-c8cb9e32df8e
group_name:
last_heartbeat_timestamp: 2023-08-22 18:48:41.037817
heartbeat_interval: 30
io_state: ON
io_thread_state: Waiting for source to send event
io_errno: 0
io_errmsg:
io_errtime: 0000-00-00 00:00:00.000000
co_state: ON
co_thread_state: Waiting for replica workers to process their queues
co_errno: 0
co_errmsg:
co_errtime: 0000-00-00 00:00:00.000000
w_state: ON
w_thread_state: waiting for handler commit
w_errno: 0
w_errmsg:
w_errtime: 0000-00-00 00:00:00.000000
time_since_last_message: 00:00:00.001134
applier_busy_state: APPLYING
lag_from_original: 00:00:01.799071
lag_from_immediate: 00:00:01.783404
transport_time: 2.26 ms
time_to_relay_log: 19.00 us
apply_time: 14.63 ms
last_applied_transaction: 54d83026-40eb-11ee-a5d3-c8cb9e32df8e:105180
last_queued_transaction: 54d83026-40eb-11ee-a5d3-c8cb9e32df8e:105547
queued_gtid_set_to_apply: 54d83026-40eb-11ee-a5d3-c8cb9e32df8e:105184-105547
*************************** 6. row ***************************
channel: clusterset_replication (2)
host: 127.0.0.1
port: 3310
user: mysql_innodb_cs_b0adbc6c
source_uuid: 2cb77a02-40eb-11ee-83f4-c8cb9e32df8e
group_name:
last_heartbeat_timestamp: 2023-08-22 18:48:41.037817
heartbeat_interval: 30
io_state: ON
io_thread_state: Waiting for source to send event
io_errno: 0
io_errmsg:
io_errtime: 0000-00-00 00:00:00.000000
co_state: ON
co_thread_state: Waiting for replica workers to process their queues
co_errno: 0
co_errmsg:
co_errtime: 0000-00-00 00:00:00.000000
w_state: ON
w_thread_state: waiting for handler commit
w_errno: 0
w_errmsg:
w_errtime: 0000-00-00 00:00:00.000000
time_since_last_message: 00:00:00.001134
applier_busy_state: APPLYING
lag_from_original: 00:00:01.797743
lag_from_immediate: 00:00:01.783390
transport_time: 2.26 ms
time_to_relay_log: 19.00 us
apply_time: 21.47 ms
last_applied_transaction: 54d83026-40eb-11ee-a5d3-c8cb9e32df8e:105181
last_queued_transaction: 54d83026-40eb-11ee-a5d3-c8cb9e32df8e:105547
queued_gtid_set_to_apply: 54d83026-40eb-11ee-a5d3-c8cb9e32df8e:105184-105547
*************************** 7. row ***************************
channel: clusterset_replication (3)
host: 127.0.0.1
port: 3310
user: mysql_innodb_cs_b0adbc6c
source_uuid: 2cb77a02-40eb-11ee-83f4-c8cb9e32df8e
group_name:
last_heartbeat_timestamp: 2023-08-22 18:48:41.037817
heartbeat_interval: 30
io_state: ON
io_thread_state: Waiting for source to send event
io_errno: 0
io_errmsg:
io_errtime: 0000-00-00 00:00:00.000000
co_state: ON
co_thread_state: Waiting for replica workers to process their queues
co_errno: 0
co_errmsg:
co_errtime: 0000-00-00 00:00:00.000000
w_state: ON
w_thread_state: waiting for handler commit
w_errno: 0
w_errmsg:
w_errtime: 0000-00-00 00:00:00.000000
time_since_last_message: 00:00:00.001134
applier_busy_state: APPLYING
lag_from_original: 00:00:01.786087
lag_from_immediate: 00:00:01.767563
transport_time: 2.26 ms
time_to_relay_log: 19.00 us
apply_time: 21.58 ms
last_applied_transaction: 54d83026-40eb-11ee-a5d3-c8cb9e32df8e:105182
last_queued_transaction: 54d83026-40eb-11ee-a5d3-c8cb9e32df8e:105547
queued_gtid_set_to_apply: 54d83026-40eb-11ee-a5d3-c8cb9e32df8e:105184-105547
*************************** 8. row ***************************
channel: clusterset_replication (4)
host: 127.0.0.1
port: 3310
user: mysql_innodb_cs_b0adbc6c
source_uuid: 2cb77a02-40eb-11ee-83f4-c8cb9e32df8e
group_name:
last_heartbeat_timestamp: 2023-08-22 18:48:41.037817
heartbeat_interval: 30
io_state: ON
io_thread_state: Waiting for source to send event
io_errno: 0
io_errmsg:
io_errtime: 0000-00-00 00:00:00.000000
co_state: ON
co_thread_state: Waiting for replica workers to process their queues
co_errno: 0
co_errmsg:
co_errtime: 0000-00-00 00:00:00.000000
w_state: ON
w_thread_state: waiting for handler commit
w_errno: 0
w_errmsg:
w_errtime: 0000-00-00 00:00:00.000000
time_since_last_message: 00:00:00.001134
applier_busy_state: APPLYING
lag_from_original: 00:00:01.785881
lag_from_immediate: 00:00:01.767550
transport_time: 2.26 ms
time_to_relay_log: 19.00 us
apply_time: 29.59 ms
last_applied_transaction: 54d83026-40eb-11ee-a5d3-c8cb9e32df8e:105183
last_queued_transaction: 54d83026-40eb-11ee-a5d3-c8cb9e32df8e:105547
queued_gtid_set_to_apply: 54d83026-40eb-11ee-a5d3-c8cb9e32df8e:105184-105547
гаСЫетИіЪгЭМЃЌЮвУЧгаСЫИќЖрЕФЯИНкЃЌР§ШчЃЌАќРЈИДжЦаФЬјЁЃЮвУЧЛЙИХЪіСЫGTIDЃЈХХЖгЁЂгІгУЁЃЉЁЃ
ЮвУЧЛЙПЩвдПДЕНгаЙиДЋЪфЪБМфЃЈЭјТчЃЉЁЂаДШыжаМЬШежОЕФЪБМфвдМАзюКѓгІгУЕФЪБМфЕФаХЯЂЁЃ
ЕБШЛЃЌФњПЩвдЪЙгУИУЪгЭМРДЯдЪОФњашвЊЕФШЮКЮФкШнЃЌР§ШчЃК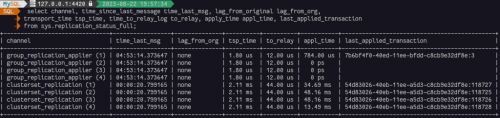
MySQL InnoDB Cluster, ClusterSet, Read Replicas
ШчЙћФњЪЙгУгЩAdmin APIгыMySQL ShellЙмРэЕФСМКУМЏГЩНтОіЗНАИЃЌФЧУДЫљгаетаЉаХЯЂЖМвбОПЩвдЪЙгУstatusЃЈЃЉЗНЗЈЛёЕУЁЃ
statusЃЈЃЉЗНЗЈПЩвдгУ3ИіжЕНјааРЉеЙЃК
1ЃКАќРЈгаЙидЊЪ§ОнАцБОЁЂзщавщАцБОЁЂзщУћГЦЁЂМЏШКГЩдБUUIDЁЂМЏШКГЩдБНЧЩЋКЭзДЬЌЕФаХЯЂЃЌШчзщИДжЦБЈИцЕФЃЌвдМАЯЕЭГБфСПСаБэЃЛ
2ЃКАќРЈгаЙиЭЈЙ§СЌНгДІРэЕФНЛвзЕФаХЯЂЃЌвдМАгІгУепЃЛ
3ЃКАќРЈгаЙиУПИіИДжЦЛњжЦЕФИќЯъЯИЭГМЦаХЯЂМЏШКГЩдБЃЛ
ШУЮвУЧРДПДвЛИіОпгаРЉеЙбЁЯю3ЕФClusterSetЪОР§ЃК
JS> cs.status({extended:3})
{
"clusters": {
"cluster2": {
"clusterRole": "REPLICA",
"clusterSetReplication": {
"applierQueuedTransactionSet": "54d83026-40eb-11ee-a5d3-c8cb9e32df8e:137385-138500",
"applierQueuedTransactionSetSize": 1116,
"applierState": "ON",
"applierStatus": "APPLYING",
"applierThreadState": "waiting for handler commit",
"applierWorkerThreads": 4,
"coordinatorState": "ON",
"coordinatorThreadState": "Waiting for replica workers to process their queues",
"options": {
"connectRetry": 3,
"delay": 0,
"heartbeatPeriod": 30,
"retryCount": 10
},
"receiver": "127.0.0.1:4420",
"receiverStatus": "ON",
"receiverThreadState": "Waiting for source to send event",
"receiverTimeSinceLastMessage": "00:00:00.002737",
"replicationSsl": null,
"source": "127.0.0.1:3310"
},
"clusterSetReplicationStatus": "OK",
"communicationStack": "MYSQL",
"globalStatus": "OK",
"groupName": "7b6bf13d-40ed-11ee-bfdd-c8cb9e32df8e",
"groupViewChangeUuid": "7b6bf4f0-40ed-11ee-bfdd-c8cb9e32df8e",
"paxosSingleLeader": "OFF",
"receivedTransactionSet": "54d83026-40eb-11ee-a5d3-c8cb9e32df8e:129-138500",
"ssl": "REQUIRED",
"status": "OK_NO_TOLERANCE",
"statusText": "Cluster is NOT tolerant to any failures.",
"topology": {
"127.0.0.1:4420": {
"address": "127.0.0.1:4420",
"applierWorkerThreads": 4,
"fenceSysVars": [
"read_only",
"super_read_only"
],
"memberId": "c3d726ac-40ec-11ee-ab38-c8cb9e32df8e",
"memberRole": "PRIMARY",
"memberState": "ONLINE",
"mode": "R/O",
"readReplicas": {},
"replicationLagFromImmediateSource": "00:00:05.420247",
"replicationLagFromOriginalSource": "00:00:05.433548",
"role": "HA",
"status": "ONLINE",
"version": "8.1.0"
},
"127.0.0.1:4430": {
"address": "127.0.0.1:4430",
"applierWorkerThreads": 4,
"fenceSysVars": [
"read_only",
"super_read_only"
],
"memberId": "709b15ea-40ed-11ee-a9b3-c8cb9e32df8e",
"memberRole": "SECONDARY",
"memberState": "ONLINE",
"mode": "R/O",
"readReplicas": {},
"replicationLagFromImmediateSource": "00:00:00.038075",
"replicationLagFromOriginalSource": "00:00:05.432536",
"role": "HA",
"status": "ONLINE",
"version": "8.1.0"
}
},
"transactionSet": "2cb77a02-40eb-11ee-83f4-c8cb9e32df8e:1-4,54d83026-40eb-11ee-a5d3-c8cb9e32df8e:1-137384,54d8329c-40eb-11ee-a5d3-c8cb9e32df8e:1-5,7b6bf4f0-40ed-11ee-bfdd-c8cb9e32df8e:1-3",
"transactionSetConsistencyStatus": "OK",
"transactionSetErrantGtidSet": "",
"transactionSetMissingGtidSet": "54d83026-40eb-11ee-a5d3-c8cb9e32df8e:137385-138552"
},
"myCluster": {
"clusterRole": "PRIMARY",
"communicationStack": "MYSQL",
"globalStatus": "OK",
"groupName": "54d83026-40eb-11ee-a5d3-c8cb9e32df8e",
"groupViewChangeUuid": "54d8329c-40eb-11ee-a5d3-c8cb9e32df8e",
"paxosSingleLeader": "OFF",
"primary": "127.0.0.1:3310",
"ssl": "REQUIRED",
"status": "OK",
"statusText": "Cluster is ONLINE and can tolerate up to ONE failure.",
"topology": {
"127.0.0.1:3310": {
"address": "127.0.0.1:3310",
"applierWorkerThreads": 4,
"fenceSysVars": [],
"memberId": "2cb77a02-40eb-11ee-83f4-c8cb9e32df8e",
"memberRole": "PRIMARY",
"memberState": "ONLINE",
"mode": "R/W",
"readReplicas": {
"127.0.0.1:4410": {
"address": "127.0.0.1:4410",
"applierStatus": "APPLYING",
"applierThreadState": "waiting for handler commit",
"applierWorkerThreads": 4,
"receiverStatus": "ON",
"receiverThreadState": "Waiting for source to send event",
"replicationSources": [
"PRIMARY"
],
"replicationSsl": "TLS_AES_256_GCM_SHA384 TLSv1.3",
"role": "READ_REPLICA",
"status": "ONLINE",
"version": "8.1.0"
}
},
"role": "HA",
"status": "ONLINE",
"version": "8.1.0"
},
"127.0.0.1:3320": {
"address": "127.0.0.1:3320",
"applierWorkerThreads": 4,
"fenceSysVars": [
"read_only",
"super_read_only"
],
"memberId": "327cb102-40eb-11ee-9904-c8cb9e32df8e",
"memberRole": "SECONDARY",
"memberState": "ONLINE",
"mode": "R/O",
"readReplicas": {},
"replicationLagFromImmediateSource": "00:00:04.536190",
"replicationLagFromOriginalSource": "00:00:04.536190",
"role": "HA",
"status": "ONLINE",
"version": "8.1.0"
},
"127.0.0.1:3330": {
"address": "127.0.0.1:3330",
"applierWorkerThreads": 4,
"fenceSysVars": [
"read_only",
"super_read_only"
],
"memberId": "3d141d7e-40eb-11ee-933b-c8cb9e32df8e",
"memberRole": "SECONDARY",
"memberState": "ONLINE",
"mode": "R/O",
"readReplicas": {},
"replicationLagFromImmediateSource": "00:00:04.652745",
"replicationLagFromOriginalSource": "00:00:04.652745",
"role": "HA",
"status": "ONLINE",
"version": "8.1.0"
}
},
"transactionSet": "2cb77a02-40eb-11ee-83f4-c8cb9e32df8e:1-4,54d83026-40eb-11ee-a5d3-c8cb9e32df8e:1-138552,54d8329c-40eb-11ee-a5d3-c8cb9e32df8e:1-5"
}
},
"domainName": "myClusterSet",
"globalPrimaryInstance": "127.0.0.1:3310",
"metadataServer": "127.0.0.1:3310",
"primaryCluster": "myCluster",
"status": "HEALTHY",
"statusText": "All Clusters available."
MySQL HeatWave
ШчЙћФудкOCIЩЯЕФMySQL HeatWaveжаЪЙгУШЮКЮРраЭЕФИДжЦЃЌФуПЩвдЪЙгУЯрЭЌЕФЪгЭМЃЌЕЋФуашвЊдкВЛЭЌЕФЪ§ОнПтЩЯДДНЈЫќУЧЃЌвђЮЊsysЪЧаДБЃЛЄЕФЁЃ
вђДЫЃЌШчЙћФњЪЙгУHAЁЂЖСШЁИББОЛђЪжЖЏИДжЦЭЈЕРЃЌФњвВПЩвдЪЙгУЯрЭЌЕФЪгЭМРДЛёЕУИДжЦЕФзМШЗИХЪіЁЃ
НсТлЃК
ИДжЦПЩЙлВьадЗЧГЃЯъЯИЃЌВЂЬсЙЉСЫДѓСПMySQL 8ЕФаХЯЂЁЃвВаэЯждкЪЧИќИФВщПДЛђМрЪгИДжЦЕФЗНЪНЕФКУЪБЛњЁЃ
ЮФеТРДдДгкmysqlВЉПЭЃКhttps://blogs.oracle.com/mysql/post/mysql-8-and-replication-observability