Oracle数据块转储并查看块的详细内容
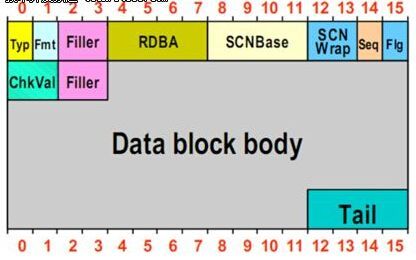
查看表所属的文件号和块号:
SYS AS SYSDBA@ORCL>SELECTsegment_name,file_id,block_id from dba_extents where owner='OE' ANDsegment_name like 'ORDERS%';
SEGMENT_NAME FILE_ID BLOCK_ID
ORDERS 5 1176
定位找出user tracefile的位置:
SYS AS SYSDBA@ORCL>SHOW PARAMETERuser_dump;
NAME TYPE VALUE
-------------------------------------------------------- ------------------------------
user_dump_dest string /u01/app/oracle/diag/rdbms/orc
l/ORCL/trace
使用dump命令转储块信息到trace文件中,并找到相应的trace文件
SYS AS SYSDBA@ORCL>ALTER SYSTEM DUMPDATAFILE 5 BLOCK 1176;
System altered.
查看块转储后的文件路径:
方法一:
SYS AS SYSDBA@ORCL>select value fromv$diag_info where name='Default Trace File';
VALUE
------------------------------------------------------------------------------------------------------------------------------------------------------
/u01/app/oracle/diag/rdbms/orcl/ORCL/trace/ORCL_ora_2286.trc
方法二:
先查到系统进程号:
SYS AS SYSDBA@ORCL>select spid fromv$process
2 where addr=(select paddr fromv$session
3 where sid=(select distinct sidfrom v$mystat));
SPID
------------------------------------------------------------------------
2286
再通过进程号查找磁盘文件:
[oracle@oracle trace]$ pwd
/u01/app/oracle/diag/rdbms/orcl/ORCL/trace
[oracle@oracle trace]$ ll *2286*
-rw-rw----. 1 oracle oracle 3611 Oct 1709:11 ORCL_ora_2286.trc
-rw-rw----. 1 oracle oracle 69 Oct 17 09:11 ORCL_ora_2286.trm
查看trace文件内容:
[oracle@oracletrace]$ cat ORCL_ora_2286.trm
@2|2|gBZ-T4s62"2286|ORCL|
M/gBZ-T4s62~81K2
6?i6X-T4s62~c9z
7?zmJ~H1L
[oracle@oracletrace]$ cat ORCL_ora_2286.trc
Trace file/u01/app/oracle/diag/rdbms/orcl/ORCL/trace/ORCL_ora_2286.trc
Oracle Database 11g Enterprise EditionRelease 11.2.0.1.0 - Production
With the Partitioning, OLAP, Data Miningand Real Application Testing options
ORACLE_HOME =/u01/app/oracle/product/11.2.2/db_1
System name: Linux
Node name: oracle
Release: 2.6.39-400.211.1.el6uek.i686
Version: #1 SMP Fri Nov 15 13:38:12 PST 2013
Machine: i686
Instance name: ORCL
Redo thread mounted by this instance: 1
Oracle process number: 29
Unix process pid: 2286, image:oracle@oracle (TNS V1-V3)
*** 2018-10-17 09:11:22.135
*** SESSION ID:(125.45) 2018-10-1709:11:22.135
*** CLIENT ID:() 2018-10-17 09:11:22.135
*** SERVICE NAME:(SYS$USERS) 2018-10-1709:11:22.135
*** MODULE NAME:(sqlplus@oracle (TNSV1-V3)) 2018-10-17 09:11:22.135
*** ACTION NAME:() 2018-10-17 09:11:22.135
Start dump data blocks tsn: 6 file#:5minblk 1176 maxblk 1176
Block dump from cache:
Dump of buffer cache at level 4 for tsn=6,rdba=20972696
Block dump from disk:
buffer tsn: 6 rdba: 0x01400498 (5/1176)
scn: 0x0000.000b9726 seq: 0x01 flg: 0x04tail: 0x97262001
frmt: 0x02 chkval: 0xde2e type: 0x20=FIRSTLEVEL BITMAP BLOCK
Hex dump of block: st=0, typ_found=1
Dump of memory from 0xB6E10600 to0xB6E12600
B6E10600 0000A220 01400498 000B972604010000 [ .....@.&.......]
B6E10610 0000DE2E 00000000 0000000000000000 [................]
B6E10620 00000000 00000000 0000000000000000 [................]
Repeat 1 times
B6E10640 00000000 00000000 0000000000000004 [................]
B6E10650 FFFFFFFF 00000000 0000000300000008 [................]
B6E10660 00010001 00000000 0000000100000000 [................]
B6E10670 00000004 00000003 4A850B454A850B45 [........E..JE..J]
B6E10680 00000000 00000000 0000000000000000 [................]
B6E10690 01400499 00000000 0000000000000008 [..@.............]
B6E106A0 00000008 014004A0 0000000000000000 [......@.........]
B6E106B0 00000000 00000005 0000000000000001 [................]
B6E106C0 00011E7F 00000003 0000000001400498 [..............@.]
B6E106D0 00000008 00000000 0000000000000000 [................]
B6E106E0 00000000 00000000 0000000000000000 [................]
Repeat 9 times
B6E10780 00000000 00000000 0000000053551511 [..............US]
B6E10790 00000000 00000000 0000000000000000 [................]
Repeat 485 times
B6E125F0 00000000 00000000 0000000097262001 [............. &.]
Dump of First Level Bitmap Block
--------------------------------
nbits : 4 nranges: 1 parent dba: 0x01400499 poffset: 0
unformatted: 0 total: 8 first useful block: 3
owning instance : 1
instance ownership changed at 08/14/2009 14:59:17
Last successful Search 08/14/2009 14:59:17
Freeness Status: nf1 0 nf2 1 nf3 0 nf4 4
Extent Map Block Offset: 4294967295
First free datablock : 3
Bitmap block lock opcode 0
Locker xid: : 0x0000.000.00000000
Inc #: 0 Objd: 73343
HWMFlag: HWM Set
Highwater:: 0x014004a0 ext#: 0 blk#: 8 ext size: 8
#blocks in seg. hdr's freelists: 0
#blocks below: 5
mapblk 0x00000000 offset: 0
--------------------------------------------------------
DBARanges :
--------------------------------------------------------
0x01400498 Length: 8 Offset: 0
0:Metadata 1:Metadata 2:Metadata 3:75-100% free
4:75-100% free 5:75-100%free 6:75-100% free 7:25-50% free
--------------------------------------------------------
End dump data blocks tsn: 6 file#: 5 minblk1176 maxblk 1176
tkprof工具格式化trace文件:
[oracle@oracle trace]$ tkprof/u01/app/oracle/diag/rdbms/orcl/ORCL/trace/ORCL_ora_3998.trc /tmp/3998.trc
TKPROF: Release 11.2.0.1.0 - Development on星期三 10月 17 10:15:32 2018
Copyright (c) 1982, 2009, Oracle and/or itsaffiliates. All rights reserved.
[oracle@oracle trace]$ cat /tmp/2286.trc
TKPROF: Release 11.2.0.1.0 - Development on星期三 10月 17 09:57:44 2018
Copyright (c) 1982, 2009, Oracle and/or itsaffiliates. All rights reserved.
Trace file:/u01/app/oracle/diag/rdbms/orcl/ORCL/trace/ORCL_ora_2286.trc
Sort options: default
********************************************************************************
count = number of times OCI procedure was executed
cpu = cpu time in seconds executing
elapsed = elapsed time in seconds executing
disk = number of physical reads of buffers from disk
query = number of buffers gotten for consistent read
current = number of buffers gotten in current mode (usually for update)
rows = number of rows processed by the fetch or execute call
********************************************************************************
Trace file:/u01/app/oracle/diag/rdbms/orcl/ORCL/trace/ORCL_ora_2286.trc
Trace file compatibility: 11.1.0.7
Sort options: default
1 session in tracefile.
0 user SQL statements in trace file.
0 internal SQL statements intrace file.
0 SQL statements in trace file.
0 unique SQL statements in tracefile.
79 lines in trace file.
0 elapsed seconds in trace file.